Territorial landslide early warning systems (Te-LEWS)

EU4-Piemonte region, Italy
The Piemonte regional warning system service, managed by the Environmental Protection Agency of Piemonte (“ARPA Piemonte” as official Italian acronym), is based on an advanced meteo-hydrological automatic monitoring system, and it is integrated with forecasting activities of severe weather-related natural hazards. In 2010 the Shallow landslides Movements Announced through Rainfall Thresholds (SMART) was developed.
1 The modelling
Tiranti and Rabuffetti developed thresholds for the Piemonte region correlating rainfall and landslides (429) occurred from 1990 to 2002. For the definition of rainfall thresholds an empirical approach was used, in particular, rainfall-induced landslides were analyzed. Each rainfall event was separated from the next by a time interval equal to 6 h, in which it is observed the absence of rain. From the total of 429 shallow landslides were discarded: i) those related to anthropogenic factor; ii) those for which the time of the occurrence was ignored. The number of landslides used for the analysis was equal to 160. The dataset obtained was used to achieve different thresholds: regional, local and "pragmatic".
The regional threshold was derived using the complete dataset of shallow landslides considering the data of critical intensity of rainfall of the closest rain-gauges, for the whole territory. As usual, the critical rainfall dataset is plotted in the log–log space using mean intensity, I [mm/h] vs. duration, d [h] (Fig. 15). To realize the local threshold two different areas on the basis of geological, topographical and distribution of rainfall in the Piedmont region were distinguished (Fig. 16). Mountain environment: zones principally characterized by metamorphic rocks, igneous rocks, dolostones or limestones and flysh formations in Alpine and Apennine environments that require high values of critical rainfall; hills environment: zones principally characterized by sedimentary bedrock in hilly and Apennine environments that require low values of critical rainfall (Tiranti e Rabuffetti 2010).
This classification contributes to a better understanding of the process but still gives sparse I–d plots (Fig. 17).

Figure 15: The Piemonte regional threshold. Unbroken line is the best fit, the dashed line is the lower envelope obtained by offsetting the best fit.

Figure 16: The two homogeneous zones in Piemonte (1 mountain environment; 2 hills environment) superimposed with hillshade map
In the "pragmatic" threshold was fixed the attention on each single rainfall event, all the recorded landslides, and related critical rainfall, are lumped into a single value of critical rainfall, calculated as the mean duration and mean rainfall cumulative, used to represent the whole event. Following this simple procedure, each marker in the I–d plot is representative of all the landslides triggered during the single rainfall event. The number of points is reduced from 160 shallow landslide records to 10 rainfall events triggering a large number of shallow landslides. Using the two zones defined previously, this general expression of the rainfall threshold was considered: I=ad^n
where “n” is the Montana coefficient (Estorge et al. 1980) characteristic of the intense rainfall in the studied area (Boni and Parodi 2001) (Fig. 18) so that in the calibration process, the variability ranges of “n” in each area is fixed while “a” remains the only free parameter.
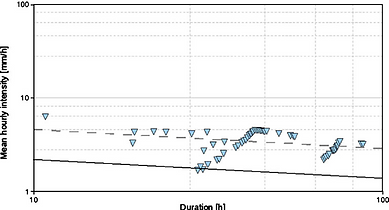


Figure 17: The Piemonte local thresholds: a. Zone 1: mountain environment, b. Zone 2: hills environment. Unbroken lines are the best fits, the dashed lines are the lower envelopes obtained by offsetting the best fits
Figure 18: Distribution of the Montana coefficient in Piemonte (Boni and Parodi 2001) and intersection with homogeneous zones.
The thresholds defined from a minimum duration of 12 h to a maximum of 60 h, respectively, for the zones 1 and 2, have the following formulation: I = 40d^-0,65; I = 25d^-0,45.
As seen in Fig. 19, the thresholds are again drawn, once fixed the slope, as the lower envelope curve of the data points.

Figure 19: I–d plots and thresholds for the two zones (darkblue dots for the mountain and light-blue dots for the hills). Each dot represents the whole rainfall-landslide event: 1 September 1993; 2 November 1994 (for mountain and hill environments); 3 September 1998; 4 April 2000; 5 October 2000; 6 May 2002; 7 June 2002; 8 July 2002; 9 August 2002 (see for details the reports provided in www.arpa.piemonte.it in the section “servizi on-line – Rapporti d’Evento”)
2 The warning strategy
A dedicated software module SMART (Shallow landslides Movements Announced through Rainfall Thresholds) is set up to elaborate the rainfall time series for each rain gauge reproducing the real-time procedures. After setting a threshold of interest (regional, local, pragmatic), SMART is able to identify the complete set of critical rainfall events for each gauge station (i.e. the cumulated rainfall is greater than the threshold value for the specific duration). The software identifies the beginning of a rainfall event, defined as 12 h of continuous rain (i.e. with interruption lasting no more than 6 h), calculates in each hourly time step the cumulated and the threshold values, verifies if the threshold exceeded and closes the event after 6 h from the end of rainfall.
The SMART module, using the pragmatic thresholds, has been installed in the operational activities of Piemonte regional warning system service (Fig. 20). The SMART on-line elaborations are organised into two phases. First, for each rain gauge, the SMART module produces: the calculation of the rainfall cumulative and duration; the calculation of the threshold at the given duration; the evaluation of the threshold overcome or approximation (cumulative higher than 85% of the threshold), respectively, indices of danger and possible danger in near future. Second, for each warning area, the number of overcomes and of approximations is used to provide an overview of the possibility to have a large number of shallow landslides. The first real-time test was a heavy rainfall event at the end of May 2008.
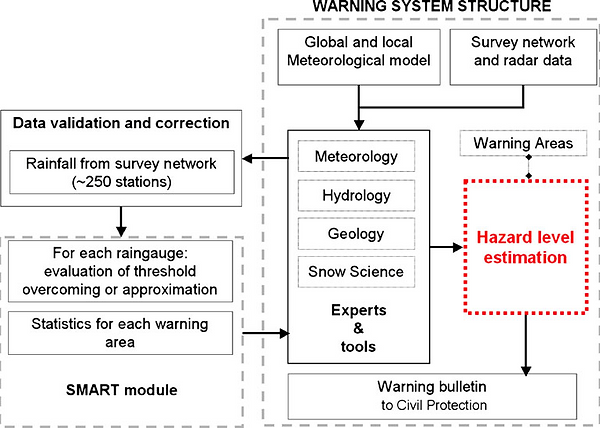
Figure 20: Flowchart of the SMART module with respect to the warning system structure
3 Performance evaluation
The verification of the different threshold sets is addressed taking into consideration both the regional rainfall database (consisting in 60 rain gauges in 1990 up to 250 in 2002) and the landslide database (the whole set of shallow landslide with known occurrence day is used).
The predictive performance of the rainfall threshold is tested. Following the same event-based approach showed previously, it was identified: a critical rainfall event when at least two gauges within the same area record critical rainfall in the same day or a shallow landslide event when at least two landslides are triggered in the same area in the same day. The performance of the warning system based on the pragmatic empirical approach is compared with that obtainable with the traditional empirical approaches. The following indicators have been defined to carry out the analysis: correct alarms (CA), missed alarms (MA), false alarms (FA) Hit Rate (HR), False Alarm Rate (FAR) and Threat Score (TS), that measures the fraction of observed and/or forecast events that were correctly predicted. These indicators allow both a relative comparison between models as well as an absolute evaluation of the model performance having in mind that a perfect model will have: HR=1; FAR=0; TS=1 (Tiranti & Rabuffetti, 2010).
References
Estorge JL, Laborde JP, Zumstein JF (1980) Mise en évidence des relations entre le gradex des pluies journalières et les gradex des pluies de durées inférieures à 24h en Lorraine. La Météorologie série VI(20–21):139–149
Boni G, Parodi A (2001) Sintesi pluviometrica regionale: realizzazione di un atlante delle piogge intense sulle Alpi franco-italiane. Rapporto Finale, Progetto INTERREG II Italia- Francia. Azione 3, 61–80
Tiranti & Rabuffetti, (2010). Estimation of rainfall thresholds triggering shallow landslides for an operational warning system implementation. Landslides (2010) 7:471–481 DOI 10.1007/s10346-010-0198-8.