Territorial landslide early warning systems (Te-LEWS)


AS5-Japan
In 2005, the Japanese government initiated a new nationwide early-warning system for landslides disasters. The main methodology of the system is to set a criterion for occurrences of debris flows and slope failures based on several rainfall indices (60-min cumulative rainfall and soil–water index) in each 5-km grid mesh covering all of Japan. Because many of the records of mass movements are lacking in scientific precision on timing and location, the system applies Radial Basis Function Network methods to set the criterion based primarily on rainfall data recorded as not triggering disasters. Since the end of March 2007, under torrential rainfall conditions, early-warning information has been disseminated as part of weather news using TV, radio, and the Internet.
The main methodology is to set a Critical Line (danger threshold) with RBFN using the rainfall indices of 60-min cumulative rainfall and calculated soil–water index. The merit of this method is the ability to apply it to areas with no prior record of disasters. Updating is easily accomplished because the system learns from the input data. The latter characteristic means that the criteria can be revised easily while the system is operating.
1 The modelling
Figure 8 presents a sketch of the basic concept, showing that it is possible to draw various lines as the criterion of disaster occurrence line (Critical Line, CL) depending on the method. A linear CL is the easiest to set, but an arbitrary shaped CL seems to be the most precise discrimination line based on the data of occurrence and non-occurrence rainfall. In the past various rainfall indices were used by the Ministry of Land, Infrastructure, Transport and Tourism (MLIT) (Terada and Nakaya 2001).

The currently adopted short-term rainfall index is the 60-min cumulative rainfall, and the long-term rainfall index is the soil–water index.
Japan Meteorological Agency (JMA) has produced 2.5-km grid mesh rainfall data since 2001 (5-km grid mesh from 1988) known as Radar Automated Meteorological Data Acquisition System analytical rainfall (Radar AMeDAS analytical rainfall) and short-time forecasts of rainfall (from 1 to 6 h; actual rainfall and forecast rainfall, respectively). These “actual” rainfall data are provided by estimating rainfall intensity with radar checked against gauged AMeDAS data. Forecast rainfall is more accurate in the nearest future. That is, forecast rainfall in the next hour is more reliable than that forecast in 6 h. These rainfall data are available to solve the 4th problem mentioned above. Using the method of Kuramoto et al. (2001), the concept of setting CL can be changed from perceiving CL as the boundary between areas of low and high probability of disaster occurrences that depend on occurrence and non-occurrence rainfall plot, to specifying the area of low probability using only the non-occurrence rainfall. The system applies Radial Basis Function Network (RBFN) methods to automatically set and refine the critical lines per each cell of the grid. However, to select CL and to determine the lowest limit of soil–water index, the records of debris-flow and slope-failure occurrences are used (Osanai et al., 2010).
Figure 8: The basic concept used for setting the criterion for issuing early-warning information in Japan. The criterion of disaster occurrence is defined as the line discriminating between the area of high and low probability of disaster occurrence.
The output value of RBFN uses the “non-occurrence” rainfall to create the response surface of the grid. Non-occurrence rainfall data has been collected for each 5-km grid mesh at 1-h time resolution for more than 10 years created by JMA. 60-minute cumulative rainfall and soil–water index are calculated for each hour using the collected data. The response surface represents a probability density function of non-occurrence rainfall. The value of the response surface is the RBFN output value as z-axis (Fig. 9). The maximum value is 1.0 because all of the 0 mm rainfalls with 0 mm of soil water are “nonoccurrence” rainfalls. The weather forecast of 1-3 hrs allows to have 5 level of different lead time warnings as a function of the amount of time before a certain rainfall causes the CL to be exceeded.

Figure 9: Output of RBFN using a test dataset of rainfall indices. Left Three dimensional view of the output response surface. Right Contoured two-dimensional plot (contour lines at 0.1 intervals a potential candidates for the critical line) of response surface on 60-min cumulative rainfall and soil water index as x and y axes, respectively
2 The response strategy
This system is aimed at facilitating the evacuation of residents in advance of the occurrence of disasters, and at assisting the decision-makers such as mayors to judge the timing of when to disseminate evacuation instructions or orders. The main players who send out early-warning information to the residential population are Japan Meteorological Agency (JMA) and local government (Fig. 10). When torrential rain is expected or falling, the timing of the issuing of early-warning information is determined by the expected values of the 60-min cumulative rainfall and soil water index calculated using the forecast rainfall for 1–3 h into the future. The progress of the actual values of the two indices is logged graphically as a snake line in the graphical space of Fig. 11 so that the likelihood of exceeding the CL in the near future can be anticipated to provide enough lead time to evacuate residents before the actual rainfall causes the CL to be exceeded. This allows JMA to initiate the early-warning of debris flows and slope failures. The weather news on a TV, radio, and the Internet then deliver the early-warning information.
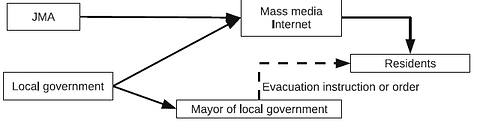
Figure 10: The role of major players in transmission of early-warning information
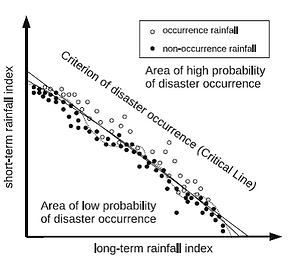
Figure 11: The evolution of the “snake line” under actual operational conditions, with projection using forecast rainfall over the next 1–3 h
References
Nobutomo Osanai, Takeshi Shimizu, Kazumasa Kuramoto, Shinichi Kojima, Tomoyuki Noro (2010). Japanese early-warning for debris flows and slope failures using rainfall indices with Radial Basis Function Network. Landslides (2010) 7:325–338 DOI 10.1007/s10346-010-0229-5
Kuramoto K, Tetsuga H, Higashi N, Arakawa M, Nakayama H, Furukawa K (2001) A study on a method for determining non-linear critical line of slope failures during heavy rainfall based on RBF network, Doboku Gakkai Ronbunshu, No.672, VI-50, pp.117-132, Japan Society of Civil Engineers (in Japanese with English Abstract)
Terada H, Nakaya H (2001) Operating methods of critical rainfall for warning and evacuation from sediment related disasters, Technical note of National Institute for Land and Infrastructure Management No.5, National Institute for Land and Infrastructure Management, p 71 (in Japanese with English Abstract) San Francisco Bay, California, USA (wilson 2005)